Potentials – Adding the Inventory

May 9th, 2019

Building Great Code

The latest addition to Potentials has been that of the outlines of the elements in the simulation - lines, points, rectangles, etc. These can be charge sheets, conductors, dielectrics, etc. - but until now, only their effects have been seen. The point is to make these items visible on their own, so that their boundaries can be seen, as well as their effects.

Since all these had to be in-place in the context of the -drawRect: method on the NSView subclass, it meant that we had to be passed in with the plotting data that was the results of the simulation. In order to make this scale well, with redraws of the NSView, we needed to pass this in with [0..1] on the linear dimensions of the drawing surface.

What we settled on was to add to the BaseSimObj a method:

/*!
 This method returns an NSDictionary with the Quartz 2D drawing data
 and keys to indicate *how* to draw that object. The axis measurements
 are normalized to [0..1] so that scaling this is very easy, and it's
 placed in the workspace so that as that region is drawn, this object
 is in the correct location. This is essential so that this guy can
 be drawn on the simulation results.
 */
- (NSDictionary*) drawingInfo:(SimWorkspace*)ws;

so that each type of object could place itself in the drawing space on the unit axes. The data is returned as an NSDictionary because it's simply a few pieces - the type of drawing needed to be done, and the data for that drawing. Here is the line's implementation:

- (NSDictionary*) drawingInfo:(SimWorkspace*)ws
{
  if (ws != nil) {
    NSRect        wsr = [ws getWorkspaceRect];
    NSPoint       beg = [self getStartPoint];
    NSPoint       end = [self getEndPoint];
    // map the point to [0..1] on each axis for plotting
    beg.x = (beg.x - wsr.origin.x)/wsr.size.width;
    beg.y = (beg.y - wsr.origin.y)/wsr.size.height;
    end.x = (end.x - wsr.origin.x)/wsr.size.width;
    end.y = (end.y - wsr.origin.y)/wsr.size.height;
    return @{@"draw" : @"line",
             @"from" : [NSValue valueWithPoint:beg],
             @"to" : [NSValue valueWithPoint:end]};
  }
  // there's nothing we can possibly do without a workspace
  return nil;
}

where the required key is draw, and that is a simple NSString of the type of drawing to do, which will then be interpreted in the -drawRect: method. Simple.

Another is the rectangle:

- (NSDictionary*) drawingInfo:(SimWorkspace*)ws
{
  if (ws != nil) {
    NSRect        wsr = [ws getWorkspaceRect];
    NSRect        rect;
    rect.size = [self getSize];
    // move the center of the rect to the origin for the NSRect
    rect.origin = [self getLocation];
    rect.origin.x -= rect.size.width/2.0;
    rect.origin.y -= rect.size.height/2.0;
    // map the point to [0..1] on each axis for plotting
    rect.origin.x = (rect.origin.x - wsr.origin.x)/wsr.size.width;
    rect.origin.y = (rect.origin.y - wsr.origin.y)/wsr.size.height;
    rect.size.width /= wsr.size.width;
    rect.size.height /= wsr.size.height;
    return @{@"draw" : @"rect",
             @"data" : [NSValue valueWithRect:rect]};
  }
  // there's nothing we can possibly do without a workspace
  return nil;
}

and as long as the drawing data can be put into an NSDictionary, we're good to go.

Then we needed to add a section to the -drawRect: method that would look at the list of all the items in the inventory, and for each, look at their drawing directions, and draw them in the context. This is the code for the first one - a line:

  for (NSDictionary* info in [self getInventory]) {
    // everything draws to the view, scaled on the
    NSString* draw = info[@"draw"];
    if ([draw isEqualToString:@"line"]) {
      // get the specifics for the line from the data
      NSPoint     beg = [info[@"from"] pointValue];
      NSPoint     end = [info[@"to"] pointValue];
      // map it to the viewport for drawing
      beg.x *= sx;
      beg.y *= sy;
      end.x *= sx;
      end.y *= sy;
      CGPoint     line[] = {beg, end};
      NSLog(@"[ResultsView -drawRect:] - drawing line inventory: (%.2f, %.2f) ->
              (%.2f, %.2f)", beg.x, beg.y, end.x, end.y);
      // draw the line in the viewport
      CGContextBeginPath(myContext);
      CGContextSetLineWidth(myContext, 1.0);
      CGContextSetRGBStrokeColor(myContext, 0.0, 0.0, 0.0, 1.0);
      CGContextAddLines(myContext, line, 2);
      CGContextStrokePath(myContext);

The interesting addition here is that when drawing a path, you really have to begin the path, add the path elements, and then stroke the path. Not bad, but it took a little bit to find that in an example to make the elements visible.

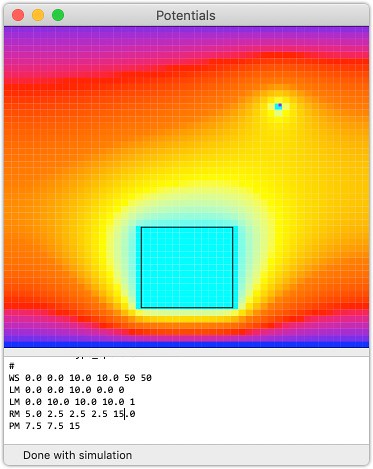
In the end, we now have the inventory:

Potentials with Inventory

And the speed is impressive. The simulations are being calculated in under 5 msec, and the drawing is being done in under 14 msec. This means that it's going to be possible to make a graphical builder - eventually, and have the results appear quite nicely. 🙂
Potentials – Added Plot Switching

May 7th, 2019

Building Great Code

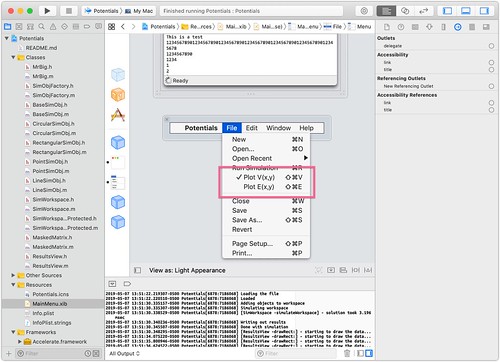
This afternoon I found an article about creating contours on data, and while it looks very reasonable, it was more than I could dig into and really get done in a few minutes. So, I looked to be able to flip between plots on the app - either V(x,y) or E(x,y), and to make it simple - I decided to just use the menu items and that would then make keyboard shortcuts easy, and the state of the plot would be reflected in the menu.

Potentials Plot Switching

With the menu items added, I simply had to make the IBOutlets for the the NSMenuItems, and then make IBActions for the menu item selections, and the code was all pretty simple:

- (IBAction) plotVxy:(id)sender
{
  BOOL                 error = NO;
 
  SimWorkspace*        ws = nil;
  // first, make sure we have a workspace to use
  if (!error) {
    ws = [self getWorkspace];
    if (ws == nil) {
      error = YES;
      NSLog(@"[MrBig -plotVxy:] - there is no defined workspace with which to run
              this simulation. Please make sure there is before calling this method.");
    }
  }
 
  // next, see if we need to switch views
  if (!error) {
    if ([[self getPlotExy] state] == 1) {
      [[self getPlotVxy] setState:1];
      [[self getPlotExy] setState:0];
      // plot the Voltage on the workspace
      if ([ws getResultantVoltage] != nil) {
        [[self getResultsView] plotVoltage:ws];
      }
    }
  }
}

And we automatically implement the mutual exclusive nature of the toggle, and if we have no data to plot, we don't waste time, but if we do, we switch the view. Simple.

These little updates are a lot of fun, and it's certainly an aspect of macOS coding that I haven't done a lot of - Graphics.

Potentials – Adding the Electric Field to the Plotting

May 6th, 2019

Building Great Code

In the original code, we did a point-by-point calculation of the magnitude and direction of the electric field based on the results of the solution of the potential on the workspace. This was fine when it was just writing it out to the file, but when we want to do the plotting of the data, it makes sense to compute the magnitude and direction of the field for all points, and save them. So that's what we've added in this most recent update.

Potentials adds Electric Field

We added the ivars, setters and getters to the SimWorkspace class, and then simplified the getters to use the ivars and now the computed values. Finally, we added in the calculation of the field to the end of the -runSim: method, and we got what we needed. At this point, we need to be able to switch between the voltage and electric field, and then add isobars, and finally, the directions on the electric field.

There is plenty yet to do, but it's really starting to take shape, and as we keep making progress, the app is really starting to come together. 🙂

Potentials – Adding Multiple Colors to Graphing

May 5th, 2019

Building Great Code

The graphs in Potentials are OK... but they are only interpolating between two colors. It's OK... but it's not as nice as I'd like it. What I wanted was to be able to have several colors in the mix - so I could come up with colors like Black Body Radiation. Then it came to me, that I could bracket the values with an array of colors, like:

  NSColor*    spectrum[] = {[NSColor redColor],
                            [NSColor orangeColor],
                            [NSColor yellowColor],
                            [NSColor cyanColor]};
  int         stages = 4;
  double      dc = 1.0/(stages - 1);

And then, for each point to plot:

  double      x = 0.0;
  int         ilow = 0;
  for (int r = 0; r < _rowCnt; r++) {
    for (int c = 0; c < _colCnt; c++) {
      x = _values[r][c];
      ilow = MIN((int)(x/dc), (stages-2));
      x -= ilow * dc;
      gc = [ResultsView interpolate:(x/dc)
                        withColorsBetween:spectrum[ilow]
                        and:spectrum[ilow+1]];

Where we're picking the value up, then finding the two bordering colors on that value, and then moving the value to the [0..1] range and then interpolating between those two colors.

In the end, it looks great:

Potentials Multi Color Graphing

It's a really nice improvement, and next we have to work on the Electric field.

Potentials – Fixed up the Simulation Results

May 4th, 2019

Building Great Code

This afternoon I was playing with the simulation data for Potentials and started to log out all the values going in, and coming out, of the dgbsv_ call, and I started to wonder if the memory was being cleared as it was returned from malloc. Given that I had seen the vDSP functions, it made sense to use those - as opposed to just calling memset, as they handle doubles and integers, and I didn't want to mess up any framing on the doubles.

When I put in that code, which was really as simple as:

  // clear out the vector with zeros
  vDSP_vclrD(b, 1, ldab*nrhs);

and similar function calls for the other matrix allocations, the code just worked.

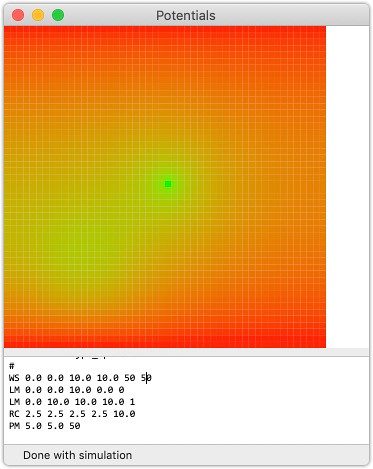
Potentials Simulation Fixed

And not just that... you can now edit the input in the editor window, and re-run it. Perfectly. Also, it's easy to reload different simulation sets, and re-run those, as well. This is exactly what I was hoping to see as the next big step. Now I need to be able to plot the electric field as well - magnitude and direction.

Potentials – Adding Plotting of Output Data

May 3rd, 2019

Building Great Code

This morning, I was able to finish up the plotting of the output data in Potentials. It's not generating the right numbers, but the NSView Quartz 2D drawing is working, and the linear color interpolation is doing its job as well. What seems to be the problem is the cLAPACK call to solve the system.

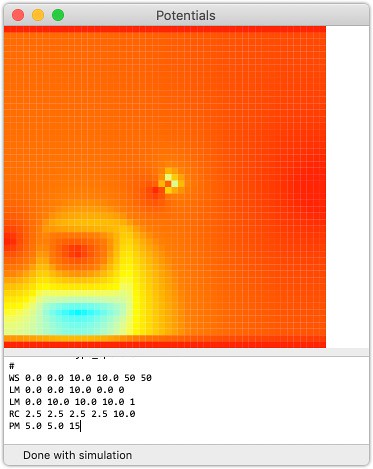
Potentials can Draw

I know this was all working years ago, so it has to be in the cLAPACK code in the Accelerate Framework in macOS - and there, anything is possible. Could be the format of the banded matrix storage changed, or the format of the numbers or structure of the A or b in the equation... but it's something... because I looked at the output, and the numbers just are not right.

The blank area at the bottom is where the data was either NaN or -Inf, and I know that's not right. And then the potential field distribution is all wrong. No way this is right. So I'll come up with a simpler test case, two line conductors, and a smaller grid, and see what's happening in more detail. It shouldn't be too hard to see what's up.

Then, it's just a matter of seeing what's next. Things are taking shape! 🙂

Potentials – Adding Initial Drawing to the App

May 1st, 2019

Building Great Code

Today I got back to Potentials and wanted to add in the initial drawing context to the app - by splitting the UI from being just an editor to an editor at the bottom of the view, and a NSView subclass on the top. The bottom editor will be the complete width of the window, and the height will be fixed at a handful of lines. Then the drawing area is the stretchable area above that.

I had to re-learn a few things - like where the outlets and actions are held, and it turned out that it really was all about the nib file format, and once it was converted to an xib, I was able to find everything where I expected to see it.

Potentials Starts Drawing

There were a few AutoLayout issues that were easy enough to correct with the xib file, and then it was a few simple drawing functions, and it's working just great. I have a lot more to do, but I think the Voltage plots are going to be pretty simple... just a color range on the values, and away we go.

It's nice to be back in ObjC and macOS... such a fun platform. 🙂

Upgrading Old Interface Builder Files

May 1st, 2019

xcode.jpg

This morning I was working on my Potentials app for macOS, and I realized that the Auto Layout constraints were not being set properly, and the Xcode 10.2.1 UI wasn't showing the existing constraints, either. I noticed this was still a nib file, and I know Xcode has moved to xib files many years ago, so I looked up how to upgrade the file's contents.

The solution was pretty easy:

  $ cd Base.lproj/
  $ ibtool MainMenu.nib --upgrade --write MainMenu.xib

and then I can add the MainMenu.xib to the project, and delete the MainMenu.nib from the project. Check it all in, and we're done.

My concern is that Xcode should have said something. Like "Upgrade this file", or "Let me upgrade this file"... but leaving it alone and not really working right - that's not really a good thing to do. Still... I've been using these tools long enough, I had a feeling it was something like this.

There is a Reason I’m an Apple Fan

April 27th, 2019

Apple Computers

Over the course of the last few weeks, I've noticed that my Late 2016 15" MacBook Pro was "rocking" a little on my desk. As if the bottom of the case was "bowed", and so pressing on the space next to the trackpad made the back-end lift up. Now I've heard about the damaged Li-Ion batteries, and even replaced one in a battery pack on my Mom's old 13" MacBook Pro several years ago, but I was in a bit of denial about this one, as I was hoping it was "something else". 🙂

Finally, yesterday I called Apple to see if the local Naperville Apple Store could replace the battery without having to ship it to the Service Center. They were vague - saying it was possible, but that would depend on a lot of things. In the end, I really had to just take it to them, and see. So I made a Genius Bar appointment.

When they saw it, they agreed - damaged Li-Ion battery, but that it'd have to go out for service. I'd be without it for 3 - 5 days. That's too long for me, as it's the only place I get my email, and notifications, and some of those are very important. So I knew it was time to get a new machine, migrate over, and then send the old one back for repair, and keep it as a spare.

Luckily, the Apple Store has a "Secret Supply" of high-end configurations that don't show up on the web site, and they had exactly the machine I would have ordered, so I could migrate things over last night. But the real surprise is that Apple would do this for free. Wow... a $300 battery replacement for free. 🙂

Sure... they probably do this because of the fire hazard, but to me - it's just free. Now I'll take it to the Apple Store today, they will ship it off to get fixed, and when it returns in a week or so, it'll be a great back-up machine.

Added a Few Things to Timeless

April 27th, 2019

Javascript

My friend, that asked for the Timeless project, pinged me yesterday to say that he really would like to have a "clear" button on the page so that it cleared out all the data in the table. I said I'd look at it today - as soon as I got back up to speed with my new laptop. More on that later. 🙂

What I needed to do was to add a function to wipe out the HandsOnTable, and that wasn't too bad... simply get the row count, and clear out the timestamp data:

  /*
   * Function to clear out the timestamps from the table, and then refresh
   * the table to make sure that it's all cleared out and ready to go.
   */
  function wipeTable(tid) {
    var rows = $(tid).handsontable('countRows');
    for (var i = 0; i < rows; i++) {
      $(tid).handsontable('setDataAtCell', i, 0, '');
      $(tid).handsontable('setDataAtCell', i, 1, '');
    }
  }

Then I just needed to update the HandsOnTable formatter for the computed difference so that if the timestamp cell was empty, we put null in the computed column, and then that would work for both the clearing and the totally empty rows:

  /*
   * The Timeline table needs to have a computed 'diff' for the current line
   * to the previous line. These are all msec times, so it's just a difference
   * of two numbers. Shouldn't be hard. :)
   */
  var timeDiff = function(instance, td, row, col, prop, value) {
    if (instance.getDataAtCell(row, 0)) {
      var a = instance.getDataAtCell(row, 1);
      var b = instance.getDataAtCell((row - 1), 1);
      value = ($.isNumeric(a) ? a : 0) - ($.isNumeric(b) ? b : 0);
    } else {
      value = null;
    }
    Handsontable.NumericRenderer.apply(this, arguments);
  }

And then I needed to place a button in the header of the panel with the table:

  <div class="panel-heading">
    <h3 class="panel-title"><span id="timelineTitle">Timeline Evolution Worksheet</span>
      <form id="wipe_table" class="navbar-form navbar-right pullright"
            role="search" style="margin-top: -8px; display: visible;">
        <button id="wipeTable" class="btn btn-default">
          <span class="glyphicon glyphicon-trash"></span>
        </button>
      </form>
    </h3>
  </div>

Finally, I needed to disable the default function of the form, and wipe the table with:

  // set up the form components to work as we need them
  $("#wipe_table").submit( function(e) {
    e.preventDefault();
    wipeTable('#timelineTable');
  });

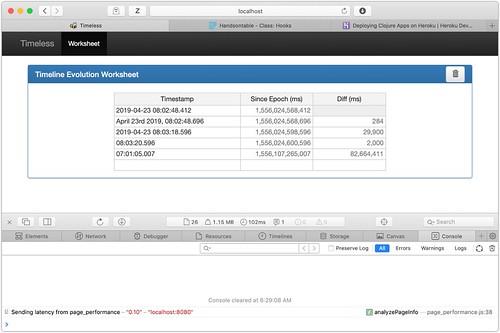
Now we have the "trash can" icon in the panel header, and it works like a charm!

Timeless Clear Table

HandsOnTable really is a nice tool. I can see doing a lot of cool things with it.