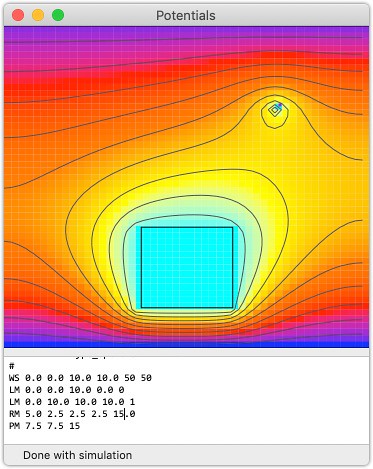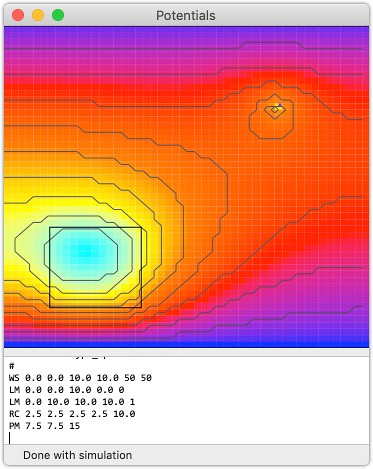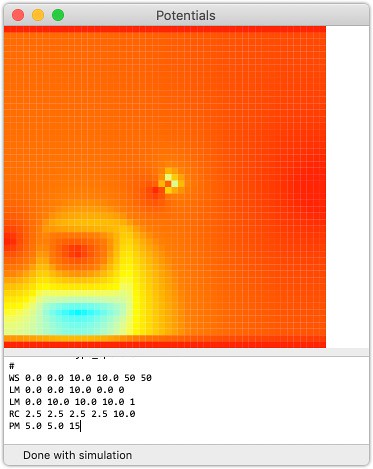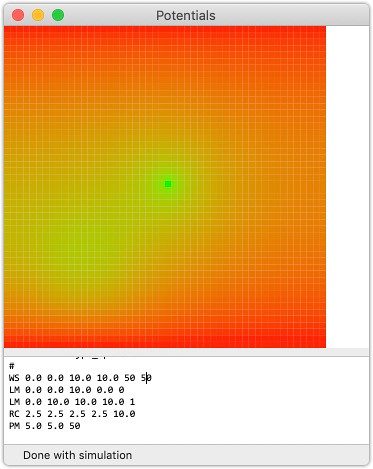
The latest addition to Potentials has been that of the outlines of the elements in the simulation - lines, points, rectangles, etc. These can be charge sheets, conductors, dielectrics, etc. - but until now, only their effects have been seen. The point is to make these items visible on their own, so that their boundaries can be seen, as well as their effects.
Since all these had to be in-place in the context of the -drawRect: method on the NSView subclass, it meant that we had to be passed in with the plotting data that was the results of the simulation. In order to make this scale well, with redraws of the NSView, we needed to pass this in with [0..1] on the linear dimensions of the drawing surface.
What we settled on was to add to the BaseSimObj a method:
/*!
 This method returns an NSDictionary with the Quartz 2D drawing data
 and keys to indicate *how* to draw that object. The axis measurements
 are normalized to [0..1] so that scaling this is very easy, and it's
 placed in the workspace so that as that region is drawn, this object
 is in the correct location. This is essential so that this guy can
 be drawn on the simulation results.
 */
- (NSDictionary*) drawingInfo:(SimWorkspace*)ws;
so that each type of object could place itself in the drawing space on the unit axes. The data is returned as an NSDictionary because it's simply a few pieces - the type of drawing needed to be done, and the data for that drawing. Here is the line's implementation:
- (NSDictionary*) drawingInfo:(SimWorkspace*)ws
{
  if (ws != nil) {
    NSRect        wsr = [ws getWorkspaceRect];
    NSPoint       beg = [self getStartPoint];
    NSPoint       end = [self getEndPoint];
    // map the point to [0..1] on each axis for plotting
    beg.x = (beg.x - wsr.origin.x)/wsr.size.width;
    beg.y = (beg.y - wsr.origin.y)/wsr.size.height;
    end.x = (end.x - wsr.origin.x)/wsr.size.width;
    end.y = (end.y - wsr.origin.y)/wsr.size.height;
    return @{@"draw" : @"line",
             @"from" : [NSValue valueWithPoint:beg],
             @"to" : [NSValue valueWithPoint:end]};
  }
  // there's nothing we can possibly do without a workspace
  return nil;
}
where the required key is draw, and that is a simple NSString of the type of drawing to do, which will then be interpreted in the -drawRect: method. Simple.
Another is the rectangle:
- (NSDictionary*) drawingInfo:(SimWorkspace*)ws
{
  if (ws != nil) {
    NSRect        wsr = [ws getWorkspaceRect];
    NSRect        rect;
    rect.size = [self getSize];
    // move the center of the rect to the origin for the NSRect
    rect.origin = [self getLocation];
    rect.origin.x -= rect.size.width/2.0;
    rect.origin.y -= rect.size.height/2.0;
    // map the point to [0..1] on each axis for plotting
    rect.origin.x = (rect.origin.x - wsr.origin.x)/wsr.size.width;
    rect.origin.y = (rect.origin.y - wsr.origin.y)/wsr.size.height;
    rect.size.width /= wsr.size.width;
    rect.size.height /= wsr.size.height;
    return @{@"draw" : @"rect",
             @"data" : [NSValue valueWithRect:rect]};
  }
  // there's nothing we can possibly do without a workspace
  return nil;
}
and as long as the drawing data can be put into an NSDictionary, we're good to go.
Then we needed to add a section to the -drawRect: method that would look at the list of all the items in the inventory, and for each, look at their drawing directions, and draw them in the context. This is the code for the first one - a line:
  for (NSDictionary* info in [self getInventory]) {
    // everything draws to the view, scaled on the
    NSString* draw = info[@"draw"];
    if ([draw isEqualToString:@"line"]) {
      // get the specifics for the line from the data
      NSPoint     beg = [info[@"from"] pointValue];
      NSPoint     end = [info[@"to"] pointValue];
      // map it to the viewport for drawing
      beg.x *= sx;
      beg.y *= sy;
      end.x *= sx;
      end.y *= sy;
      CGPoint     line[] = {beg, end};
      NSLog(@"[ResultsView -drawRect:] - drawing line inventory: (%.2f, %.2f) ->
              (%.2f, %.2f)", beg.x, beg.y, end.x, end.y);
      // draw the line in the viewport
      CGContextBeginPath(myContext);
      CGContextSetLineWidth(myContext, 1.0);
      CGContextSetRGBStrokeColor(myContext, 0.0, 0.0, 0.0, 1.0);
      CGContextAddLines(myContext, line, 2);
      CGContextStrokePath(myContext);
The interesting addition here is that when drawing a path, you really have to begin the path, add the path elements, and then stroke the path. Not bad, but it took a little bit to find that in an example to make the elements visible.
In the end, we now have the inventory:
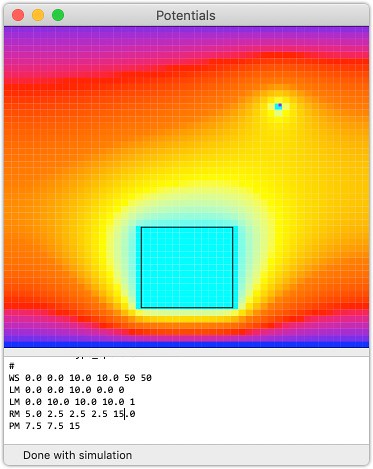
And the speed is impressive. The simulations are being calculated in under 5 msec, and the drawing is being done in under 14 msec. This means that it's going to be possible to make a graphical builder - eventually, and have the results appear quite nicely. 🙂

