Potentials – Accurate Registration

For the last several days, I have been noodling on a problem with Potentials that hasn't been the top thing to do - until today. And I wanted to figure this out once and for all, and get things really lined up properly. The problem starts with the simulation grid. It's an nxm grid, where the solution will be calculated on each of the grid points - exactly. It's then up to me to visually represent that as best I can.
The initial code took each of these points and created a rectangle for each on the viewport of the NSView, and then selected the best color, and filled in that rectangle. So far, so good.
But then the contour lines required that we take groups of 4 points and (possibly) draw a line in the box they defined. Now we have a problem. As you look at the box for a contour line, it will be "colored" by the node value in the lower-left corner. Not ideal. This means that there would be a row, and a column, of rectangles that represent the edge nodes of the simulation - but no way to put contour lines in those boxes.
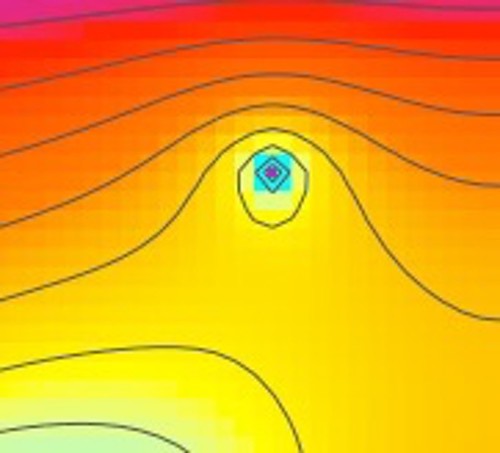
The solution was to treat the rectangle fill the same way as the contour lines - to take all four points in each square and compute a single value for the painting that rectangle. For a first cut, it seemed reasonable to have a simple MAX() function of all four values - yes, this will inflate the effect of an isolated node, but that's OK... it's the maximum value - in that area. I can live with that.
The results are really nice. The contour lines and the items under simulation and colors line up very nicely. This is a blown up section around the point conductor in the example:
At the same time, the contour lines now go to the edge of the display, as they should, and if I need to change the algorithm for the colorization of the rectangles - based on the four point values - that's easy enough to change.
Looking better and better. 🙂
