Archive for the ‘Open Source Software’ Category

Moving Sharded Redis Servers

Friday, October 24th, 2014

Redis Database

This morning I found that I really needed to move some of my shared redis servers. Due to the needed bandwidth, I've got eight redis servers on one 196GB RAM box, but this morning, I saw that the total RAM in use was over 170GB, and it was causing issues when redis tried to fork and save the data.

This is what I love about redis and this sharding - I can simply shut things down, move the redis dump.rdb files, fire up the servers on the new machines, and everything will load back up and be ready to go. A simple change in the sharing logic to point to the new machine for those moved servers, and everything is back up and running. Very nice.

Yes, it's very manual as well, but sometimes, the costs of that manual configuration are really worth it. Today it paid off. Big.

Finding the Joy in Life Again

Wednesday, October 22nd, 2014

Great News

I honestly would have put money on the fact that this would not have happened today. Big money.

I'm sitting on the bus riding to work, and I realize that I'm pretty happy without a pain-causing personal relationship in my life. That was a wow! moment. I've been separated for about 2 years, and the divorce is in the works, but I would have bet real money I'd feel horrible for the rest of my natural life. But today... on the bus... for a few minutes... I didn't.

That was huge for me. Huge.

Then I'm in work, updating a few postings with the results of the tests I'd done overnight, and I'm back into the swing of posting like I used to. It's been a long two years, but I'm back to writing about what I'm doing, and it's really helping. I'm feeling like I'm enjoying myself again.

This, too, was huge for me.

I don't expect this to last all day... but the fact that I have felt this way tells me that I need to keep doing what I'm doing - keep moving forward, and then maybe this will come again. And maybe when it comes again, it'll last longer. Maybe.

Struggling with Storm and Garbage Collection

Tuesday, October 21st, 2014

Finch Experiments

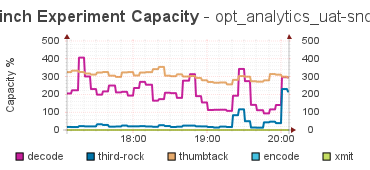
OK, this has to be one of the hardest topologies to balance I've had. Yeah, it's only been a few days, but Holy Cow! this is a nasty one. The problem was that it was seemingly impossible to find a smoking gun for the jumps in the Capacity of the bolts for the topology. Nothing in the logs. Nothing to be found on any of the boxes.

It has been a pain for several days, and I was really starting to get frustrated with this guy. And then I started to think more about the data I had already collected, and where that data - measured over and over again, was really leading me. I have come to the conclusion it's all about Garbage Collection.

The final tip has been the emitted counts from the bolts during these problems:
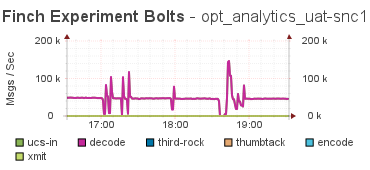
Bolt Counts

where the corresponding capacity graph looks like:
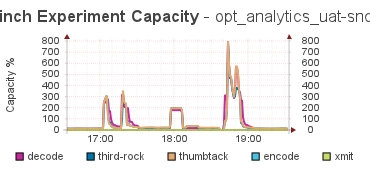
Bolt Counts

The tip was that there was a drop in the emitted tuples, and then a quick spike up, and then back to the pre-incident levels. This tells me that something caused the flow of tuples to nearly stop, and then the system caught back up again, and the integral over that interval was the same as the average flow.

What lead me to this discovery is that all the spikes in the Capacity graph were 10 min long. Always. That was too regular to be an event, and as I dug into the code for Storm, it was clear it was using a 10 min average for the Capacity calculation, and that explains the duration - it took 10 mins for the event to be wiped from the memory of the calculation, and for things to return to normal.

Given that, I wasn't looking for a long-term situation - I was looking for an event, and with that, I was able to start looking at other data sources for something that would be an impulse event that would have a 10 min duration effect on the capacity.

While I'm not 100% positive - yet - I am pretty sure that this is the culprit, so I've taken steps to spread out the load of the bolts in the topology to give the overall topology more memory, and less work per worker. This should have a two-fold effect on the Garbage Collection, and I'm hoping it'll stay under control.

Only time will tell...

UPDATE: HA! it's not the Garbage Collection - it's the redis box! It appears that the redis servers have hit the limit on the forking and writing to disk, and even the redis start-up log says that there should be the system setting:

  vm.overcommit_memory = 1

to /etc/sysctl.conf and then reboot or run the command:

  sysctl vm.overcommit_memory=1

for this to take effect immediately. I did both on all the redis boxes. I'm thinking this is the problem after all.

Best results I could have hoped for:
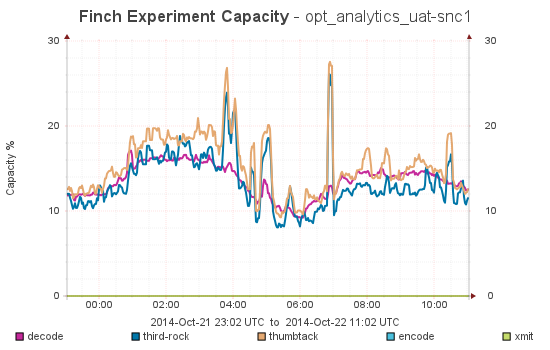
Bolt Counts

Everything is looking much better!
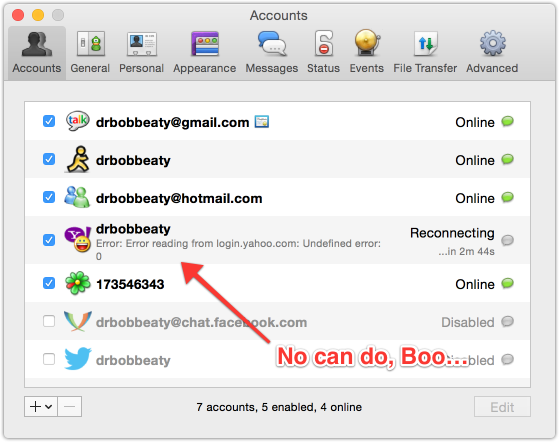
Adium 1.5.10, Yahoo!, and OS X 10.10 aren’t Happy

Monday, October 20th, 2014

Adium.jpg

Turns out that Adium 1.5.10 and Yahoo! IM isn't happy with OS X 10.10 - it's saying that it can't connect to the Yahoo! IM server and erring out. Normally, this wouldn't be an issue for me, but I've got a few friends that I stay in touch with all the time, and because of their employer, two of them have been kinda off-limits to me for a while - but one finally found his way back to me through Yahoo! IM.

While I'm really loving the changes in OS X 10.10, sadly, with the update, the Yahoo! IM connection has failed to work. And it's not at all helpful in any way:

Bolt Counts

What I've read from the Adium blog is that there is a known fix - but there's a potential security concern, and I'm not at all sure why they are delaying releasing a patch for Yosemite... but they are.

So I'm out of touch with an old friend until I can get an update from Adium. This is one of the issues with Open Source - abandoned software. I'm sure the point is that I can pick it up and fix it, and I might be able to, but it's a pain, and it's something I've come to depend on. In that, I like paying for things.

Changing the Topology to Get Stability (cont.)

Monday, October 20th, 2014

Storm Logo

I think I've finally cracked the nut of the stability issues with the experiment analysis topology (for as long as it's going to last) - it's the work it's doing. And this isn't a simple topology - so the work it's doing is not at all obvious. But it's all there. In short - I think it's all about Garbage Collection and what we are doing differently in the Thumbtack version than in the Third-Rock version.

For example, we had a change of the data schema in redis so that we had the following in the code to make sure that we didn't read any bad data:

  (defn get-trips
    "The experiment name and variant name visited for a specific browserID are held
    in redis in the following manner:
 
      finch|<browserID> => <expr-name>|<browser>|<t-src>|<variant>|<country> => 0
 
    and this method will return a sequence of the:
 
      <expr-name>|<browser>|<t-src>|<variant>|<country>
 
    tuples for a given browserID. This is just a convenience function to look at all
    the keys in the finch|<browserID> hash, and keep only the ones with five values
    in them. Pretty simple."
    [browserID]
    (if browserID
      (let [all (fhkeys (str *master* "|" browserID))]
        (filter #(= 4 (count (filter #{\|} %))) all))))

where we needed to filter out the bad tuples. This is no longer necessary, so we can save a lot of time - and GC by simply using:

  (defn get-trips
    "The experiment name and variant name visited for a specific browserID are held
    in redis in the following manner:
 
      finch|<browserID> => <expr-name>|<browser>|<t-src>|<variant>|<country> => 0
 
    and this method will return a sequence of the:
 
      <expr-name>|<browser>|<t-src>|<variant>|<country>
 
    tuples for a given browserID. This is just a convenience function to look at all
    the keys in the finch|<browserID> hash. Pretty simple."
    [browserID]
    (if browserID
      (fhkeys (str *master* "|" browserID))))

At the same time, it's clear that in the code I was including far too much data in the analysis. For example, I'm looking at a decay function that weights the most recent experiment experience more than the next most distant, etc. This linear weighting pretty simple and pretty fast to compute. It basically says to weight each event differently - with a simple linear decay.

I wish I had better tools for drawing this, but I don't.

This was just a little too computationally intensive, and it made sense to hard-code these values for different values of n. As I looked at the data, when n was 20, the move important event was about 10%, and the least was about 0.5%. That's small. So I decided to only consider the first 20 events - any more than that and we are really spreading out the effect too much.

Then there was the redis issues...

Redis is the bread-n-butter of these storm topologies. Without it, we would have a lot more work in the topologies to maintain state - and then get it back out. Not fun. But it seems that redis has been having some issues this morning, and I needed to shut down all the topologies, and then restart all the redis servers (all 48 of them).

I'm hoping that the restart settles things down - from the initial observations, it's looking a lot better, and that's a really good sign.

Changing the Topology to Get Stability (cont.)

Friday, October 17th, 2014

Storm Logo

I have been working one the re-configuration of the experimental analysis topology to try and get stability, and it's been a lot more difficult than I had expected. What I'm getting looks a lot like this:

Instability

and that's no good.

Sadly, the problem is not at all easy to solve. What I'm seeing when I dig into the Capacity numbers for the bolts are that there's only one of the 300+ bolts that has a capacity number that exceeds 1.000 - and then by a lot. But all the others are less than 0.200 - well under control. So why?

I've looked at logs, I've looked at the logs - nothing... I've looked at the tuples moving through the bolts, and interestingly, found that many of them just aren't moving any tuples. Why? no clue, but it's easy enough to scale it back to me a more efficient topology.

What I've come away with is the idea that might be the different way we're dealing with the data. So this weekend, if I have time, I'll dig in and see what I can do to make this more even between the two. It's not obvious, but then - that's 0.9.0.1 software.

Changing the Topology to Get Stability

Thursday, October 16th, 2014

Storm Logo

OK... it turns out that I needed to change my topology in order to get stability, and it's only taken me a day (or so) to find this out. It's been a really draining day, but I've learned that there is a lot more about Storm that I don't know - than that which I do.

Switching from having one bolt that calls two functions to two bolts each calling one function - should certainly have a lot more communication overhead. Interestingly, it's how I regained stability. The lesson I've learned - Make bolts as small and purposeful as possible.

Amazing...

Fixed Log Configs for SIngle-File Logging

Thursday, October 16th, 2014

Storm Logo

This morning I wanted to take some time to make sure that I got all the log messages into one file, and that not being a redirection of stdout or stderr. This is something I've done a few times, and it just took the time to set up the Logback config file. The reason we're using Logback is that this is what Storm uses, and since this is a Storm jar, we needed to use this style of logging.

Interestingly, the config wasn't all that hard to get a nice, daily-rotating, compressing, log file for everything I needed:

<configuration scan="true">
  <appender name="FILE"
            class="ch.qos.logback.core.rolling.RollingFileAppender">
    <file>/home/${USER}/log/experiments.log</file>
    <rollingPolicy
        class="ch.qos.logback.core.rolling.TimeBasedRollingPolicy">
      <fileNamePattern>
        /home/${USER}/log/experiments_%d{yyyy-MM-dd}.log.gz
      </fileNamePattern>
      <maxHistory>30</maxHistory>
    </rollingPolicy>
    <encoder>
      <pattern>
        [%d{yyyy-MM-dd HH:mm:ss.SSS}:%thread] %-5level %logger{36} - %msg%n
      </pattern>
    </encoder>
  </appender>
 
  <appender name="STDOUT" class="ch.qos.logback.core.ConsoleAppender">
    <encoder>
      <pattern>
        [%d{yyyy-MM-dd HH:mm:ss.SSS}:%thread] %-5level %logger{36} - %msg%n
      </pattern>
    </encoder>
  </appender>
 
  <root level="INFO">
    <appender-ref ref="FILE" />
  </root>
</configuration>

I have to admit that this is a decent tool - if you know how to configure it properly. But I guess that's true for a lot of the Apache projects.

Re-Tuning Experiment Topology

Wednesday, October 15th, 2014

Finch Experiments

Anytime you add a significant workload to a storm cluster, you really need to re-balance it. This means looking at the work each bolt does, making sure there is the proper balance between the bolts at each phase of the processing, and then that there are enough workers to handle the cumulative throughput. It's not a trivial job, but it's a lot of experimentation and then looking for patterns and zeroing in on the solution.

That's what I've been doing for several hours, and I'm no where near done. It's getting closer, and I think I have the problem isolated, and it's very odd. Basically, there are a few bolt instances - say 4 out of 160 - that are above 1.0 - the rest are at least a factor of ten less. This is my problem. Something is causing these few bolts to take too long, and then that skews the metric for all the instances of that bolt.

Fixing Replication on Postgres

Wednesday, October 15th, 2014

PostgreSQL.jpg

This morning I noticed that my replicated database wasn't synced to the master, and that meant that something had happened to cause the master to be moving too much data, or have too long a pause time to keep synced. Re-establishing the link isn't all that hard, but it takes time - so I turned off the process feeding data into the master database, and then, as the postgres user I coped the files from the master to the slave:

  $ cd /var/groupon
  $ rsync -av --exclude postgresql.conf --exclude postmaster.pid
          pgsql/ db2:/var/groupon/pgsql/

and then I simply need to restart the properly configured slave, and restart, and the log will report:

  LOG: streaming replication successfully connected to primary