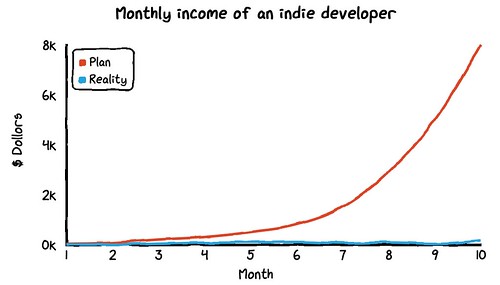
Fantastic Lighthearted Javascript Graphing Package

This morning I was reading the newsfeeds, and came across probably my favorite Javascript graphing package: Chart.xkcd. The idea is that it can be used to create those seemingly hand-drawn charts the the xkcd comic so often generates as part of their work. But this is easily put into React and other web frameworks, and put on web pages for that casual look that brings a completely different feel to the data being presented.
From the simple docs on the web page, it seems pretty straight-forward... you have to set up all the data for the graph, and then it just renders it. There are some nice mouse-over features as you dig a little deeper, but it's the casual nature of the presentation that really appeals to me:
I don't have a project yet that's in need of this, but I can feel that there will be something coming soon that could really use this less-serious approach to data presentation. After all, not everything is a publication-ready presentation.
